- Visibility 13 Views
- Downloads 4 Downloads
- DOI 10.18231/j.ijor.2024.016
-
CrossMark

Correlation of serum calcium, phosphorus, and Vitamin D in osteoporosis: An observational study
- Author Details:
-
Suman Medhi *
-
 Chinmoy Das
-
Deepika Lahon
-
Maitreyee Bora
-
Roshan Deb
Introduction
Osteoporosis is marked by reduced bone density and the breakdown of bone microarchitecture, which results in greater bone fragility and a heightened risk of fractures. Although precise figures are unavailable, estimates suggest that around 25 million people in India may be affected. Recent studies have shown a significant prevalence of vitamin D deficiency throughout India, affecting all ages and both genders, particularly in urban areas. Limited sunlight exposure, darker skin pigmentation, and diets low in vitamin D are key factors contributing to this deficiency. [1]
Among the critical nutritional components affecting bone health are calcium, phosphorus, and vitamin D. Calcium is vital for maintaining bone structure, while phosphorus plays a key role in bone mineralization. Vitamin D is crucial for facilitating calcium absorption in the intestines and maintaining adequate serum calcium and phosphorus levels. Deficiencies or imbalances in these nutrients can lead to impaired bone metabolism and contribute to the development of osteoporosis. [2]
Calcium is the fifth most abundant intracellular element in the body and is the primary cation present. The majority of the body’s calcium about 99% is stored in the skeleton, primarily in the form of extracellular crystals with a composition close to hydroxyapatite (Ca10(PO4)6(OH)2).[3] In the bloodstream, nearly all calcium is found in the plasma, with an average concentration around 9.5 mg/dL (2.38 mmol/L). Plasma calcium exists in three forms: approximately 50% as free ions, 40% bound to plasma proteins (mainly albumin), and 10% complexed with small anions. Extracellular calcium plays essential roles in bone mineralization and blood clotting. It also stabilizes cell membranes, affecting their permeability and excitability. Low serum calcium levels increase neuromuscular excitability, potentially leading to tetany. Hypocalcaemia, or low total serum calcium, may result from reductions in either albumin-bound or free calcium, or both.[4] Hypoalbuminemia, the most frequent cause of low total calcium with normal free calcium (referred to as pseudohypocalcemia), is common in conditions such as chronic liver disease, nephrotic syndrome, heart failure, and malnutrition, as albumin binds approximately 0.8 mg/dL of calcium per 1 g/dL.[5] Phosphorus, present as both inorganic and organic phosphate, is a crucial and widely distributed element in the human body. Hypophosphatemia, or low phosphate levels, can result from phosphate shifting from extracellular to intracellular spaces, excessive phosphate loss through the kidneys, reduced absorption in the intestines, or depletion of intracellular phosphate.[6] Vitamin D encompasses a group of fat-soluble vitamins that play a key role in enhancing the absorption of calcium, magnesium, and phosphate in the intestines, along with supporting various other biological functions. In humans, the most significant compounds in this group are vitamin D3 (cholecalciferol) and vitamin D2 (ergocalciferol). Both cholecalciferol and ergocalciferol can be obtained through diet or supplements. However, dietary or skin-derived vitamin D is inactive and requires enzymatic conversion (hydroxylation) in the liver and kidneys to become biologically active.[7]
Numerous studies have highlighted the importance of these minerals in bone health; however, the specific interactions and correlations between serum calcium, phosphorus, and vitamin D levels in individuals with osteoporosis require further exploration. This observational study aims to investigate these correlations in a cohort of subjects of women above 50 years and presenile age group of men above 60 years diagnosed with osteoporosis. By analyzing serum levels of calcium, phosphorus, and vitamin D, this research seeks to contribute to a better understanding of the role these nutrients play in osteoporosis management and prevention. The findings may inform clinical practices and dietary recommendations aimed at improving bone health in at-risk populations.
Materials and Methods
Study design
This observational study involved 100 subjects involving post menoupausal women of more than 50 years and age group of men of more than 60 years, diagnosed with osteoporosis based on dual-energy X-ray absorptiometry (DEXA) scans. Participants were recruited from outpatient clinics and indoor patient (Orthopaedic and Medicine Departments).
Inclusion criteria
Patients in the age group of 50 years and above.
Diagnosed cases of osteoporosis.
Diagnosed cases of osteoporosis with fracture.
Women of more than 50 years and men of more than 60 years.
Exclusion criteria
Cases of secondary osteoporosis like osteoarthritis, osteomalacia, osteopenia any musculoskeletal defect, trauma, any other pathogenic fracture.
Alcoholic patients, cirrhosis, pregnant woman, cancer patient, other autoimmune diseases, hepatitis, malaria, dengue.
Patients receiving treatment with calcium or phosphorus or vitamin D supplements.
Patients not willing to participate in the study.
Ethical clearance
Clearance certificate from the Institutional Ethical Committee (Human) of Tezpur Medical College & Hospital, Tezpur was obtained prior to the commencement of the study.
Method
This study conducted under the department of Biochemistry and Department of orthopaedics (OPD and indoor Patients). 100 subjects were taken as diagnosed case of osteoporosis and osteoporotic fracture diagnosed by DEXA and BMD scans.
Basic investigation including complete blood count (CBC), serum creatinine, estimation of lipid profile, calcium phosphorus and vitamin D levels were carried out in all the patients included in the study.
Sample collection
All the patients fulfilling the above criteria are informed about the study being conducted and only those who agreed, were enrolled in the study.
The enrolled subjects are then interviewed and examined clinically and recorded in a case sheet proforma.
After obtaining consent from the patient, 5 ml of venous blood is drawn by vein puncture of the median cubital vein under aseptic precautions.
Methods of evaluations Estimation of serum calcium, phosphorus and Vitamin D was done in vitro 5600 which works on the principle of spectrophotometry. The serum was separated and centrifuged for 3 min at 3000 rpm in a clinical centrifuge machine.
Sample Analysis Estimation of Calcium on Vitros 5600
Principles of the Procedure
The Calcium test is a multilayered, analytical element coated on a polyester support. A drop of patient sample is deposited on the slide and is evenly distributed by spreading layer to the underlying layers. The bound calcium is dissociated from binding proteins, allowing the calcium to penetrate the spreading layer into the underlying reagent layer. There, the calcium forms a complex with Arsenazo Ⅲ dye, causing a shift in the absorption maximum. After incubation, the reflection density of the colored complex is measured spectrophotometrically. The amount of coloured complex formed is proportional to the calcium concentration in the sample.
Estimation of Phosphorus on Vitros 5600
Principle and Procedure
The phosphorus test is a multilayered, analytical element coated on a polyester support. A drop of patient sample is deposited on the slide and is evenly distributed by spreading layer to the underlying layers. Inorganic phosphorus react with ammonium molybdate to form a phosphomolybdate complex.
Estimation of Vitamin D on Vitros 5600
Principle and Procedure
A competitive immunoassay technique is used which involves the release of the25-OH Vitamin D detected in the sample from the binding protein using a low pH denaturant and the subsequent competition of the free 25-OH Vitamin D with horseradish peroxidase (HRP) labelled 25 –OH Vitamin D reagent for monoclonal anti-Vitamin D bound to the wells. Unbound materials are removed by washing. The bound HRP conjugate is measured by a luminescent reaction.
Quality control material mimics the characteristics of patient samples and are commercially available. Quality control material will be run every 24 hrs for authenticity of the reports. The test results will be accepted only when quality control results will be found to be within acceptable range.
Results
In our study, we investigated the correlation between serum calcium, phosphorus, and vitamin D levels in individuals with osteoporosis, focusing on specific age groups vulnerable to the condition. The study population included postmenopausal women aged above 50 years and men in the presenile age group, above 60 years, as these demographics are at higher risk of developing osteoporosis due to age-related hormonal changes and bone density loss.
|
Micronutrients |
Average value |
|
Calcium |
6.66 mg/dl |
|
Phosphorus |
2.94 mg/dl |
|
Vitamin D |
24.96 ng/ml |
|
|
Calcium |
|
|
|
Total |
|
|
Vitamin D |
Hypocalcaemia |
Percentage |
Normal Calcium |
Percentage |
Total |
Percentage |
|
Vitamin D Deficiency |
22 |
22.92 |
0 |
0.00 |
22 |
22.00 |
|
Vitamin D Insufficient |
53 |
55.21 |
4 |
100.00 |
57 |
57.00 |
|
Vitamin D Sufficient |
21 |
21.88 |
0 |
0.00 |
21 |
21.00 |
|
Total |
96 |
100 |
4 |
100.0 |
100 |
100.00 |
|
Pearson r |
Calcium vs. Vitamin D |
|
r |
0.4403 |
|
95% confidence interval |
0.2669 to 0.5860 |
|
R squared |
0.1938 |
|
P value |
|
|
P (two-tailed) |
<0.0001 |
|
P value summary |
Ns |
|
Significant? (alpha = 0.05) |
Yes |
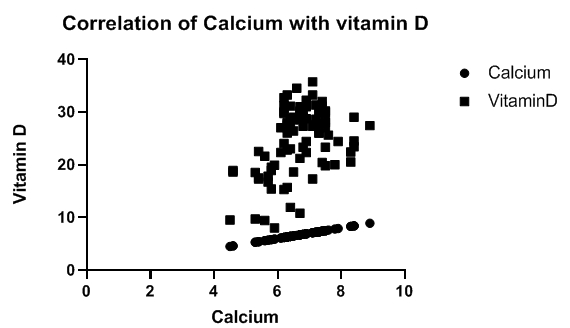
The [Table 1], [Table 2] illustrates that individuals with vitamin D deficiency or insufficiency predominantly exhibit hypocalcemia (average 6.66mg/dl), with 22% and 55.21% respectively showing low calcium levels. ([Table 1], [Table 2] ) Only a small percentage of individuals with sufficient vitamin D levels also have normal calcium levels, indicating a positive correlation between vitamin D levels and calcium regulation. The scatter plot ([Figure 1]) further supports this correlation, showing an overall trend where higher vitamin D levels are associated with increased calcium values, though there is notable data variability.
The [Table 3] shows a moderate positive correlation (r = 0.4403) between calcium and vitamin D levels, with the correlation being statistically significant (p < 0.0001). The confidence interval (0.2669 to 0.5860) confirms the reliability of this positive association.
|
Calcium |
Phosphorus |
Percentage |
|
Hypocalcemia |
96 |
96.00 |
|
Normal Calcium |
4 |
4.00 |
|
Pearson r |
Calcium vs.Phosphorus |
|
r |
0.06864 |
|
95% confidence interval |
-0.1295 to 0.2615 |
|
R squared |
0.004712 |
|
P value |
|
|
P (two-tailed) |
0.4974 |
|
P value summary |
Ns |
|
Significant (alpha = 0.05) |
No |
|
Vitamin D |
Phosphorus |
Percentage |
|
Vitamin D Sufficient |
21 |
21 |
|
Vitamin D Deficiency |
22 |
22 |
|
Vitamin D Insufficient |
57 |
57 |

|
Pearson r |
Phosphorus vs. Vitamin D |
|
r |
-0.01609 |
|
95% confidence interval |
-0.2118 to 0.1809 |
|
R squared |
0.000259 |
|
P value |
|
|
P (two-tailed) |
0.8737 |
|
P value summary |
Ns |
|
Significant (alpha = 0.05) |
No |
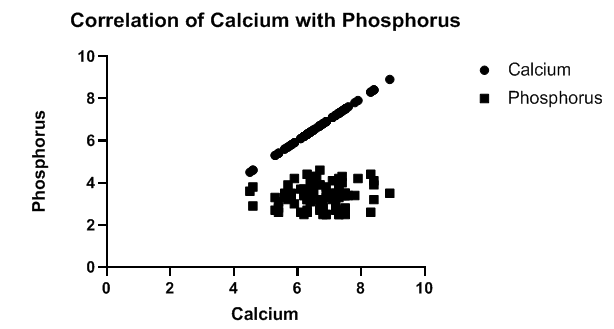
The [Table 4] and scatter plot ([Figure 2]) suggest a strong correlation between calcium and phosphorus levels, with 96% of individuals showing hypocalcemia associated with normal phosphorus levels. Only 4% of the individuals with normal calcium levels have corresponding normal phosphorus levels. The scatter plot indicates a direct relationship where higher calcium values are typically linked with higher phosphorus.
The [Table 5] indicates a very weak positive correlation (r = 0.06864) between calcium and phosphorus, which is not statistically significant (p = 0.4974). The 95% confidence interval (-0.1295 to 0.2615) includes zero, confirming no meaningful association.
The table 6 and scatter plot ([Figure 3] ) demonstrate that vitamin D levels do not show a strong correlation with phosphorus levels. The Pearson correlation coefficient (𝑟 = 0.01609) ([Table 7]) indicates an almost negligible, weak inverse relationship between vitamin D and phosphorus levels. This weak correlation is visualized in the scatter plot, where variations in vitamin D levels are spread across a narrow range of phosphorus levels, suggesting that phosphorus levels are relatively stable regardless of vitamin D status.
Discussion
In our study, we observed that individuals with vitamin D deficiency or insufficiency primarily exhibit hypocalcemia, with 22% and 55.21% showing low calcium levels, respectively. A smaller proportion of those with sufficient vitamin D levels maintain normal calcium levels, suggesting a positive association between vitamin D levels and calcium regulation. The scatter plot ([Figure 1]) reinforces this correlation, showing a general trend where increased vitamin D levels correlate with higher calcium values, despite some variability in the data. Consistent with our findings, Aul AJ et al. (2019)[8] reported that serum calcium and 25-hydroxyvitamin D deficiencies contribute to potentially life-threatening complications associated with vitamin D deficiency. Similarly, TD Thacher et al. (2011)[9] highlighted individual variability in the physiological effects of vitamin D and its interaction with calcium, underscoring the complex relationship between these nutrients. [1], [2]
In our study the [Table 3] demonstrates a moderate positive correlation (r = 0.4403) between calcium and vitamin D levels, with a statistically significant result (p < 0.0001). In contrast, Table 5 reveals a very weak positive correlation (r = 0.06864) between calcium and phosphorus, which is not statistically significant (p = 0.4974).
In our study, we found a strong correlation between calcium and phosphorus levels, with 96% of individuals exhibiting hypocalcemia alongside normal phosphorus levels. Only 4% of those with normal calcium levels also had normal phosphorus levels, suggesting a direct association where increased calcium is often linked to increased phosphorus, as shown in the scatter plot. Similarly, Jafari-Giv Z et al. (2019)[10] reported that serum calcium levels are associated with serum phosphate levels, with variations observed across different menopausal statuses in women. Additionally, Shakoor S et al. (2014)[11] found a significant association between serum calcium and phosphorus levels with age and osteoporosis, supporting the relationship seen in our findings.
In our study, we determined that vitamin D levels do not exhibit a strong correlation with phosphorus levels, as indicated by the Pearson correlation coefficient (𝑟 = -0.01609), which suggests an almost negligible, weak inverse relationship. This weak correlation is evident in the scatter plot, where vitamin D levels vary across a narrow range of phosphorus levels, indicating that phosphorus remains relatively stable regardless of vitamin D status. Consistent with our findings, Brot C et al. (1999)[12] and Cewen Liu et al. (2018)[13] also reported no significant correlation between serum vitamin D and phosphorus levels among postmenopausal women.
Conclusion
From our study we can conclude that vitamin D[14], [15] plays a significant role in maintaining calcium balance but has limited effect on phosphorus regulation. This highlights the value of monitoring both vitamin D and calcium levels in managing osteoporosis, as phosphorus levels seem largely independent of vitamin D status. Additional research is warranted to further explore these relationships and their potential clinical relevance.
Strength
Focused Analysis on Key Biomarkers: The study specifically examines the correlation between serum calcium, phosphorus, and vitamin D levels, providing targeted insights into their relationships within osteoporotic individuals. This focus allows for a clearer understanding of how these biomarkers interact in the context of bone health.
Relevance to Clinical Practice: By investigating these common biomarkers, the findings can be directly applied to clinical practice, highlighting the importance of monitoring vitamin D and calcium levels in osteoporosis management.
Foundation for Future Research: With its observational approach, the study offers a foundational dataset that can be used for larger studies or clinical trials, paving the way for further exploration into vitamin D, calcium, and phosphorus dynamics in osteoporosis.
Limitations
Sample Size: With a sample size of only 100, the study may lack sufficient statistical power to detect subtle correlations, potentially limiting the generalizability of the findings to the broader population of osteoporotic patients.
Single-Center Study: If conducted within a single clinical setting, the findings might be influenced by regional or demographic factors, which could impact the external validity of the results.
Ethical No
2024/099/TMC&H
Conflict of Interest
The authors declare no conflicts of interest.
Source of Funding
None.
References
- N Malhotra, A Mithal. Osteoporosis in Indians. Indian J Med Res 2008. [Google Scholar]
- N Khazai, SE Judd, V Tangpricha. Calcium and vitamin D: skeletal and extraskeletal health. Curr Rheumatol Rep 2008. [Google Scholar]
- AC Ross, CL Taylor, AL Yaktine. Institute of Medicine (US) Committee to Review Dietary Reference Intakes for Vitamin D and Calcium. Dietary Reference Intakes for Calcium and Vitamin D 2011. [Google Scholar]
- R Nader, HA Rita, WT Carl. . Tietz Fundamentals of Clinical Chemistry and Molecular Diagnostics 2018. [Google Scholar]
- A Goyal, C Anastasopoulou, M Ngu. . Hypocalcemia. [Updated 2023 Oct 15] 2023. [Google Scholar]
- S Sharma, MF Hashmi, J Kaur. . Hypophosphatemia 2024. [Google Scholar]
- MF Holick. High prevalence of vitamin D inadequacy and implications for health. Mayo Clin Proc 2006. [Google Scholar]
- AJ Aul, PR Fischer, JS O'Grady, KC Mara, JA Maxson, AM Meek. Population-Based Incidence of Potentially Life-Threatening Complications of Hypocalcemia and the Role of Vitamin D Deficiency. J Pediatr 2019. [Google Scholar] [Crossref]
- TD Thacher, BL Clarke. Vitamin D insufficiency. Mayo Clin Proc 2011. [Google Scholar]
- Z Jafari-Giv, A Avan, F Hamidi, M Tayefi, H Ghazizadeh, F Ghasemi. Association of body mass index with serum calcium and phosphate levels. Diabetes Metab Syndr 2019. [Google Scholar]
- S Shakoor, F Ilyas, N Abbas, MA Mirza, S Arif. Prevalence of osteoporosis in relation to serum calcium and phosphorus in aging women. J Glob Innov Agric Soc Sci 2014. [Google Scholar]
- C Brot, N Jørgensen, OR Madsen, LB Jensen, OH Sørensen. Relationships between bone mineral density, serum vitamin D metabolites and calcium: phosphorus intake in healthy perimenopausal women. J Intern Med 1999. [Google Scholar]
- C Liu, H Li. Correlation of the severity of chronic kidney disease with serum inflammation, osteoporosis and vitamin D deficiency. Exp Ther Med 2019. [Google Scholar]
- G Voulgaridou, SK Papadopoulou, P Detopoulou, D Tsoumana, C Giaginis, FS Kondyli. Vitamin D and Calcium in Osteoporosis, and the Role of Bone Turnover Markers: A Narrative Review of Recent Data from RCTs. Diseases 2023. [Google Scholar] [Crossref]
- P Lips, N M Van Schoor. The effect of vitamin D on bone and osteoporosis. Best Pract Res Clin Endocrinol Metab 2011. [Google Scholar]